Vertical Picture Graphs within 10 2-128
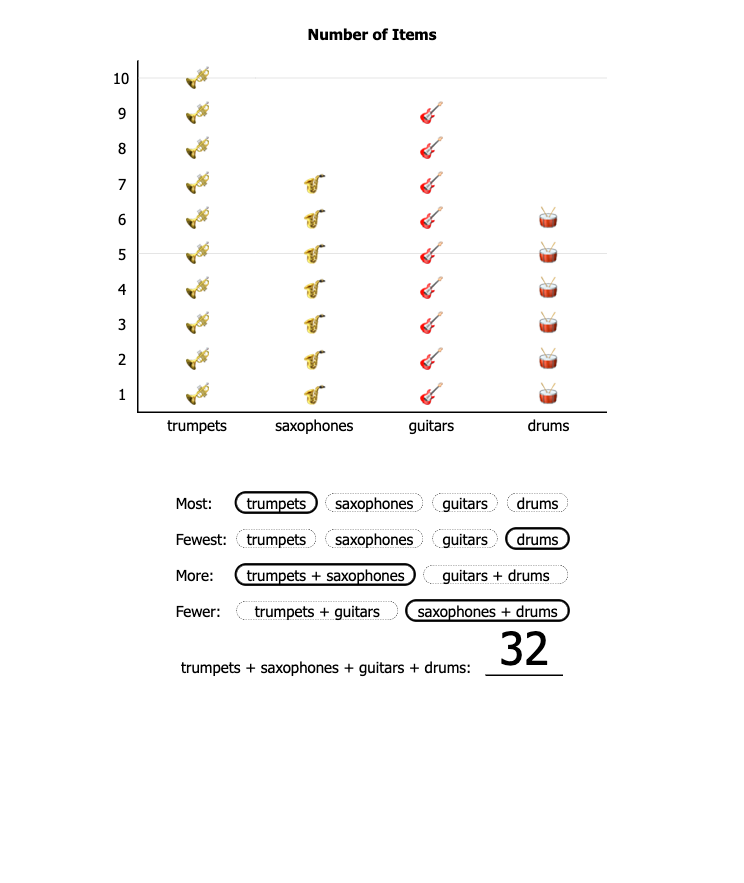
Use vertical picture graphs to make sense of data and provide context for operations. Which category has the greatest number of objects – the most? Which has the least number of objects – the fewest? Find the sum of any 2 categories. Compare and quantify their differences. How many objects in all – the sum of 4 addends?
star_border
star_border
star_border
Want more? Try Graph Detective E!