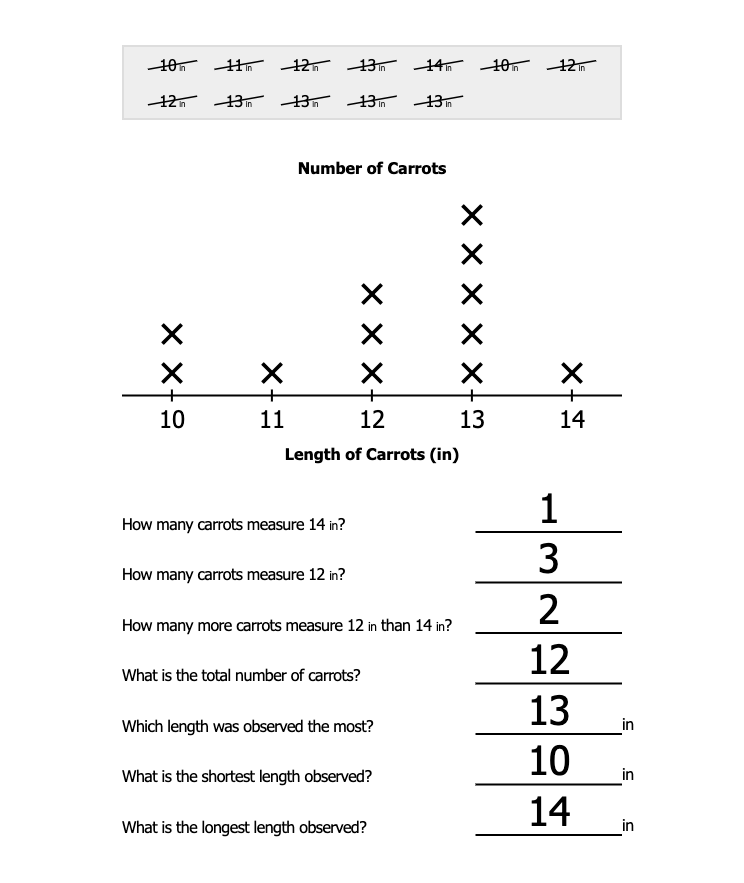
Line Plots with Standard Units 2-132

Introduce line plots as a visual way to make sense of data and provide context for measuring length and weight. Plot the frequency of lengths measured to the nearest inch or foot, and the measurement of weight measured to the nearest ounce or pound. What's the minimum length or weight? What's the maximum length or weight? Which length or weight is observed most? Explore data both as individual observations and also as a group.


1. Learn

play_circle_outline

Introduce line plots as a visual way to make sense of data and provide context for measuring length and weight. Plot the frequency of lengths measured to the nearest inch or foot, and the measurement of weight measured to the nearest ounce or pound. What's the minimum length or weight? What's the maximum length or weight? Which length or weight is observed most? Explore data both as individual observations and also as a group.

star_border

2. Practice

Lesson
2-132
Lesson
2-132
Lesson
2-132
star_border

3. Apply

POD
2-132
POD
2-132
POD
2-132
star_border
Want more? Try Gone Fishin' A!